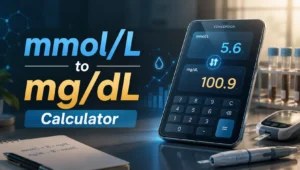
mmol/L ↔ mg/dL Converter 🧪
Convert international laboratory concentrations with molecular weight & clinical interpretation.
ℹ️ Info: Bidirectional conversion: mg/dL = mmol/L × molecular weight ÷ 10 and mmol/L = mg/dL × 10 ÷ molecular weight. Choose popular analyte presets or enter custom molecular weight. Results include clinical interpretation.
⚠️ Important: This calculator is for educational and general reference purposes only. Always consult with qualified healthcare professionals for interpretation of laboratory results. Reference ranges may vary depending on laboratory and individual conditions.
📊 Conversion Results
🔬 Calculation Breakdown
📐 Formula & Steps
Formula:
—
Example steps will be shown after calculation.
📚 Educational Info
The conversion uses the analyte's molecular weight to transform amount (mmol/L) into mass concentration (mg/dL). 1 mmol/L × (g/mol) = mg/L; dividing by 10 gives mg/dL. For common glucose labs, multiply mmol/L by ~18.0156 to get mg/dL.
📋 Typical Reference Ranges Table
| Analyte | Normal (mmol/L) | Normal (mg/dL) | Notes |
|---|---|---|---|
| Glucose (fasting) | 3.9–5.5 | 70–99 | 8-hour fast |
| Glucose (2-hr PP) | <7.8 | <140 | Post prandial |
| Total cholesterol | <5.2 | <200 | Low risk |
| LDL cholesterol | <3.4 | <130 | Bad cholesterol |
| HDL cholesterol | >1.0 | >40 | Good cholesterol |
| Triglycerides | <1.7 | <150 | 12-hour fast |
| Urea (BUN) | 2.5–8.3 | 15–50 | Kidney function |
| Creatinine | 0.06–0.11 | 0.7–1.3 | Kidney function |
| Uric acid | 0.15–0.42 | 2.5–7.0 | Higher in men |
📜 Conversion History
mmol/L to mg/dL Calculator is an essential tool for anyone who needs to convert blood glucose measurements between two of the most widely used units in the world. Whether you are living with diabetes, monitoring your blood sugar levels for health reasons, working in healthcare, or simply reviewing laboratory reports from another country, understanding how to convert glucose readings accurately is crucial. Because different healthcare systems use different measurement standards, many people often encounter confusion when comparing blood sugar results from international sources.
Blood glucose monitoring plays a central role in modern diabetes management. In countries such as the United States, glucose levels are typically reported in milligrams per deciliter (mg/dL), while countries including the United Kingdom, Canada, Australia, and much of Europe commonly use millimoles per liter (mmol/L). As global healthcare becomes increasingly connected, patients, healthcare professionals, researchers, and travelers frequently need a reliable way to switch between these units without making calculation errors.
A trusted blood glucose conversion calculator helps eliminate guesswork and ensures consistency when interpreting glucose readings. Even a small misunderstanding in measurement units can lead to confusion about whether blood sugar levels are within a healthy range, approaching prediabetes, or indicating diabetes. This is why accurate glucose conversion has become an important part of diabetes education and self-management worldwide.
Beyond simple unit conversion, understanding the relationship between mmol/L and mg/dL can provide valuable insight into blood sugar trends, glucose targets, fasting readings, post-meal measurements, and long-term diabetes control. Learning how these units work together enables patients and healthcare providers to communicate more effectively, especially when accessing international medical resources, research studies, or digital health platforms.
In this comprehensive guide, you will learn how an mmol/L to mg/dL Calculator works, the science behind glucose conversion formulas, common blood sugar ranges, conversion charts, practical examples, diabetes monitoring strategies, and the latest best practices for interpreting blood glucose results. By the end of this article, you will have a clear understanding of how to convert glucose measurements confidently and use blood sugar data more effectively in everyday health management.
What Is an mmol/L to mg/dL Calculator?
Managing blood glucose levels is one of the most important aspects of diabetes care and overall metabolic health. Whether someone is living with Type 1 diabetes, Type 2 diabetes, prediabetes, or simply monitoring their blood sugar for preventive health purposes, understanding glucose measurements is essential.
One challenge many people encounter is that blood glucose readings are reported using different measurement units depending on the country, healthcare system, laboratory, or glucose monitoring device. Some countries use millimoles per liter (mmol/L), while others use milligrams per deciliter (mg/dL).
This difference often creates confusion when reviewing medical reports, reading international research, traveling abroad, or using imported glucose monitoring equipment. An mmol/L to mg/dL calculator solves this problem by instantly converting blood glucose values from one unit into another.
A reliable calculator helps patients, caregivers, healthcare professionals, and researchers interpret blood sugar readings accurately and consistently.
Definition of mmol/L and mg/dL
Before discussing how a glucose conversion calculator works, it is important to understand the two measurement systems involved.
mmol/L (millimoles per liter) measures the concentration of glucose molecules in a liter of blood. This unit focuses on the actual number of glucose particles present.
mg/dL (milligrams per deciliter) measures the mass or weight of glucose contained within a specific blood volume.
Although both units represent the same physiological information, they express it differently.
For example:
- 4 mmol/L = 72 mg/dL
- 5 mmol/L = 90 mg/dL
- 6 mmol/L = 108 mg/dL
- 7 mmol/L = 126 mg/dL
The underlying glucose level remains identical; only the reporting format changes.
How a Blood Glucose Conversion Calculator Works
A blood glucose conversion calculator uses a mathematical formula based on the molecular weight of glucose.
To convert mmol/L into mg/dL:
mg/dL = mmol/L × 18
To convert mg/dL into mmol/L:
mmol/L = mg/dL ÷ 18
Modern online calculators perform this conversion instantly.
Users simply:
- Enter a glucose value.
- Select the current unit.
- Click convert.
- Receive the equivalent value in the other measurement system.
Many diabetes apps, healthcare portals, glucose monitoring platforms, and smart devices now include built-in conversion tools.
Why Healthcare Systems Use Different Units
Different countries adopted glucose measurement standards independently.
Historically:
- North America favored weight-based measurements.
- Europe adopted SI (International System of Units) standards.
- Scientific organizations gradually promoted mmol/L for consistency with other laboratory values.
Because healthcare infrastructure develops differently across regions, both systems remain widely used today.
As a result, millions of patients encounter both units throughout their lifetime.
Common Scenarios Requiring Unit Conversion
Several situations make glucose conversion necessary.
Traveling Internationally
A patient accustomed to mg/dL may visit a country using mmol/L and suddenly see unfamiliar numbers.
For example:
- Home reading: 110 mg/dL
- Foreign clinic report: 6.1 mmol/L
Without conversion knowledge, interpretation becomes difficult.
Reading Research Papers
Medical journals often publish glucose data using SI units.
Researchers and healthcare professionals may need quick conversions to compare findings.
Reviewing Imported Medical Devices
Some glucose meters arrive preconfigured to display either mmol/L or mg/dL.
Understanding conversion prevents unnecessary concern.
Communicating With International Specialists
Telemedicine consultations increasingly connect patients with healthcare professionals across borders.
Conversion ensures everyone interprets glucose values correctly.
Benefits of Using an Online Glucose Conversion Tool
Modern conversion calculators provide several advantages.
Speed
Calculations are completed instantly.
Accuracy
Automated formulas reduce human error.
Convenience
Accessible through smartphones, tablets, and computers.
Educational Value
Users gradually learn relationships between common glucose values.
Better Diabetes Management
Consistent interpretation supports informed treatment decisions and improved monitoring.
Understanding Blood Glucose Measurement Units
Blood glucose measurements help assess how effectively the body regulates sugar.
These values guide:
- Diabetes diagnosis
- Medication adjustments
- Nutritional planning
- Exercise recommendations
- Emergency interventions
Understanding the measurement unit is just as important as understanding the number itself.
What Does mmol/L Mean?
mmol/L stands for millimoles per liter.
A mole is a scientific unit used to count molecules.
Because glucose molecules are extremely small, laboratories measure them in millimoles rather than full moles.
When a glucose reading reports:
5 mmol/L
it means that five millimoles of glucose are present in every liter of blood.
This method focuses on molecular concentration.
Scientists often prefer concentration-based measurements because they provide consistency across laboratory analyses.
Advantages of mmol/L
- Aligned with SI standards
- Widely used in scientific literature
- Common in Europe and Commonwealth countries
- Easy comparison with other biochemical tests
Example Readings
| mmol/L | Interpretation |
|---|---|
| 3.9 | Lower end of normal |
| 5.0 | Normal fasting |
| 6.0 | Elevated |
| 7.0 | Diabetes threshold |
| 10.0 | High glucose level |
What Does mg/dL Mean?
mg/dL stands for milligrams per deciliter.
This unit measures the actual weight of glucose in blood.
For example:
90 mg/dL
means there are 90 milligrams of glucose in every deciliter of blood.
This approach emphasizes mass rather than molecule count.
Advantages of mg/dL
- Familiar to many healthcare providers
- Long history in North America
- Commonly used in glucose meters
- Easy recognition among patients
Example Readings
| mg/dL | Interpretation |
|---|---|
| 70 | Lower normal limit |
| 90 | Normal fasting |
| 100 | Slightly elevated |
| 126 | Diabetes threshold |
| 180 | High after meals |
Historical Background of Glucose Measurement Standards
Blood glucose measurement evolved significantly during the twentieth century.
Early testing methods lacked standardization.
Different laboratories used different units, making comparisons difficult.
As clinical chemistry advanced, countries gradually selected preferred measurement systems.
North America continued using weight-based units.
Europe increasingly adopted SI units during laboratory modernization efforts.
Today, both standards coexist globally.
This dual-system environment makes conversion tools highly valuable.
Countries That Commonly Use mmol/L
Several nations primarily report blood glucose using mmol/L.
United Kingdom
The United Kingdom follows SI unit standards throughout its healthcare system.
Patients typically see glucose readings such as:
- 4.5 mmol/L
- 5.8 mmol/L
- 7.2 mmol/L
rather than mg/dL values.
Canada
Canadian healthcare providers generally use mmol/L.
Educational resources, laboratory reports, and glucose monitoring devices are designed around this unit.
Australia
Australia widely uses mmol/L in hospitals, clinics, and diabetes education programs.
Patients learn glucose targets based on mmol/L values from diagnosis onward.
New Zealand
New Zealand follows a similar approach, using SI-based reporting standards across healthcare settings.
Most European Countries
Many European nations use mmol/L, including:
- Germany
- France
- Sweden
- Norway
- Denmark
- Netherlands
- Belgium
- Finland
- Switzerland
This consistency simplifies cross-border healthcare collaboration within Europe.
Countries That Commonly Use mg/dL
Several healthcare systems continue using mg/dL.
United States
The United States remains the largest user of mg/dL measurements.
Patients commonly monitor glucose using values such as:
- 70 mg/dL
- 100 mg/dL
- 180 mg/dL
Japan
Japan traditionally uses mg/dL reporting standards.
Most laboratory systems and diabetes management resources reflect this preference.
South Korea
South Korea also commonly reports blood glucose using mg/dL.
Selected Latin American Countries
Many countries in Latin America continue using mg/dL, although practices vary depending on healthcare infrastructure and laboratory standards.
mmol/L to mg/dL Formula Explained
Understanding the mathematical relationship between mmol/L and mg/dL helps patients interpret blood glucose values confidently.
While online calculators provide instant results, knowing the formula offers additional flexibility.
The Scientific Conversion Formula
The standard formula is:
mg/dL=mmol/L×18
For reverse conversion:
mmol/L=18mg/dL
These equations are accepted worldwide and used in clinical practice.
Why the Conversion Factor Is 18
The conversion factor originates from the molecular weight of glucose.
Glucose has a molecular weight of approximately:
180.16 grams per mole
After adjusting for laboratory reporting units:
- millimoles
- liters
- milligrams
- deciliters
the conversion factor becomes approximately 18.
This value has become the global standard for blood glucose conversion.
Mathematical Explanation Behind Blood Glucose Conversion
The relationship can be simplified as:
1 mmol/L of glucose equals approximately 18 mg/dL.
Therefore:
- 2 mmol/L = 36 mg/dL
- 3 mmol/L = 54 mg/dL
- 4 mmol/L = 72 mg/dL
and so forth.
Because the relationship is linear, calculations remain straightforward.
Examples of Manual Calculations
4 mmol/L to mg/dL
Formula:
4 × 18
Result:
72 mg/dL
5 mmol/L to mg/dL
Formula:
5 × 18
Result:
90 mg/dL
6 mmol/L to mg/dL
Formula:
6 × 18
Result:
108 mg/dL
7 mmol/L to mg/dL
Formula:
7 × 18
Result:
126 mg/dL
This value is especially important because it corresponds to a key diabetes diagnostic threshold.
10 mmol/L to mg/dL
Formula:
10 × 18
Result:
180 mg/dL
This level often represents a common upper target after meals.
15 mmol/L to mg/dL
Formula:
15 × 18
Result:
270 mg/dL
This reading indicates significant hyperglycemia and warrants careful monitoring.
Common Conversion Mistakes to Avoid
Several errors frequently occur.
Multiplying Instead of Dividing
When converting mg/dL to mmol/L, some users mistakenly multiply.
Correct approach:
Divide by 18.
Rounding Too Aggressively
Excessive rounding can affect interpretation.
Example:
- Accurate: 5.6 mmol/L
- Over-rounded: 6 mmol/L
The difference may influence clinical decisions.
Confusing Units
Always verify which unit appears on:
- Laboratory reports
- CGM devices
- Glucose meters
- Mobile applications
Entering Incorrect Values
Double-check decimal placement before conversion.
A misplaced decimal can dramatically alter results.
mmol/L to mg/dL Conversion Chart
Conversion charts remain one of the fastest ways to interpret blood glucose readings.
Many patients memorize common values for daily use.
Quick Reference Blood Sugar Conversion Table
| mmol/L | mg/dL |
|---|---|
| 2 | 36 |
| 3 | 54 |
| 4 | 72 |
| 5 | 90 |
| 6 | 108 |
| 7 | 126 |
| 8 | 144 |
| 9 | 162 |
| 10 | 180 |
| 11 | 198 |
| 12 | 216 |
| 13 | 234 |
| 14 | 252 |
| 15 | 270 |
| 16 | 288 |
| 17 | 306 |
| 18 | 324 |
| 19 | 342 |
| 20 | 360 |
Low Blood Sugar Conversion Values
Hypoglycemia generally begins below:
| mmol/L | mg/dL |
|---|---|
| 3.9 | 70 |
| 3.5 | 63 |
| 3.0 | 54 |
| 2.8 | 50 |
| 2.5 | 45 |
These values require prompt attention, particularly for insulin users.
Normal Blood Sugar Conversion Values
Healthy glucose ranges typically include:
| mmol/L | mg/dL |
|---|---|
| 4.0 | 72 |
| 4.5 | 81 |
| 5.0 | 90 |
| 5.5 | 99 |
| 6.0 | 108 |
Prediabetes Conversion Values
Prediabetes often falls within:
| mmol/L | mg/dL |
|---|---|
| 5.6 | 101 |
| 5.8 | 104 |
| 6.0 | 108 |
| 6.1 | 110 |
| 6.4 | 115 |
These readings indicate increased diabetes risk.
Diabetes Range Conversion Values
Diagnostic diabetes thresholds commonly include:
| mmol/L | mg/dL |
|---|---|
| 7.0 | 126 |
| 8.0 | 144 |
| 9.0 | 162 |
| 10.0 | 180 |
| 11.1 | 200 |
Emergency Blood Sugar Levels
Very high glucose levels may require urgent medical evaluation.
| mmol/L | mg/dL |
|---|---|
| 15 | 270 |
| 18 | 324 |
| 20 | 360 |
| 25 | 450 |
| 30 | 540 |
Persistent readings within these ranges may indicate serious metabolic complications and should not be ignored.
mg/dL to mmol/L Calculator Guide
While many countries use mmol/L as the standard unit for blood glucose reporting, millions of people around the world still receive glucose readings in mg/dL. For this reason, understanding reverse conversion is just as important as learning how to convert mmol/L into mg/dL.
Patients frequently encounter mg/dL values when:
- Using imported glucose meters
- Reading laboratory reports from the United States
- Reviewing international diabetes research
- Traveling abroad
- Consulting healthcare providers from different countries
A reliable mg/dL to mmol/L calculator helps eliminate confusion and ensures accurate interpretation of blood sugar results.
Reverse Conversion Formula
The reverse conversion formula is straightforward:
mmol/L=18mg/dL
This formula works because one mmol/L of glucose is equivalent to approximately 18 mg/dL.
To perform a manual conversion:
- Take the mg/dL value.
- Divide it by 18.
- Round to one decimal place if needed.
For example:
- 90 mg/dL ÷ 18 = 5.0 mmol/L
- 126 mg/dL ÷ 18 = 7.0 mmol/L
- 180 mg/dL ÷ 18 = 10.0 mmol/L
Modern calculators automate this process instantly.
When Reverse Conversion Is Needed
Many situations require converting mg/dL into mmol/L.
International Medical Consultations
Telehealth services allow patients to speak with healthcare professionals worldwide. A patient in Canada may receive records from an American clinic and need to convert the values for local interpretation.
Reviewing Research Studies
Many diabetes studies published in North America report glucose measurements using mg/dL. Researchers working in SI-unit countries often convert these figures into mmol/L.
Imported Monitoring Devices
Some glucose monitoring devices are configured for mg/dL by default. Users accustomed to mmol/L may need conversion until they adjust device settings.
Travel and Relocation
Individuals relocating between countries often encounter different measurement systems and must become familiar with both units.
Practical Examples
Understanding common conversions helps build confidence.
70 mg/dL to mmol/L
Calculation:
70 ÷ 18 = 3.9 mmol/L
Result:
3.9 mmol/L
This level is commonly used as the threshold for hypoglycemia.
100 mg/dL to mmol/L
Calculation:
100 ÷ 18 = 5.6 mmol/L
Result:
5.6 mmol/L
This reading is often considered the upper end of normal fasting glucose.
140 mg/dL to mmol/L
Calculation:
140 ÷ 18 = 7.8 mmol/L
Result:
7.8 mmol/L
This value is frequently referenced in post-meal glucose assessments.
180 mg/dL to mmol/L
Calculation:
180 ÷ 18 = 10.0 mmol/L
Result:
10.0 mmol/L
Many diabetes treatment plans use this level as an upper post-meal target.
250 mg/dL to mmol/L
Calculation:
250 ÷ 18 = 13.9 mmol/L
Result:
13.9 mmol/L
This level indicates significant hyperglycemia and may require intervention.
Accuracy Considerations
Accuracy is critical when converting glucose values.
Decimal Precision
Small differences can influence clinical decisions.
For example:
- 5.5 mmol/L
- 5.9 mmol/L
Although close numerically, they may have different clinical implications.
Device Calibration
Glucose meters vary slightly due to manufacturing tolerances. Conversion cannot correct inaccurate device readings.
Laboratory Variations
Different laboratories may use different testing methodologies. Minor differences are normal.
Double-Checking Units
Always verify whether a report displays:
- mg/dL
- mmol/L
Misinterpreting the unit can lead to serious misunderstanding of glucose status.
Why Blood Glucose Unit Conversion Matters
Some people assume glucose conversion is merely a mathematical exercise. In reality, accurate conversion can directly affect diabetes management, treatment decisions, and communication with healthcare providers.
As healthcare becomes increasingly global, understanding both measurement systems offers significant advantages.
International Travel and Diabetes Management
Traveling internationally presents unique challenges for people living with diabetes.
A traveler from the United Kingdom may be accustomed to readings such as:
- 5.0 mmol/L
- 6.5 mmol/L
- 8.0 mmol/L
After arriving in the United States, glucose meters, laboratory reports, and healthcare providers may use:
- 90 mg/dL
- 117 mg/dL
- 144 mg/dL
Without conversion knowledge, interpreting these values becomes difficult.
Travelers who understand both systems can:
- Monitor glucose confidently
- Understand local medical advice
- Respond appropriately to emergencies
- Communicate effectively with clinicians
Reading Foreign Medical Reports
Medical tourism continues to grow worldwide.
Patients often seek specialized care in other countries and receive laboratory reports that use unfamiliar units.
Examples include:
- Diabetes consultations
- Endocrinology evaluations
- Pregnancy monitoring
- Surgical assessments
Accurate conversion ensures test results remain meaningful regardless of location.
Understanding Global Diabetes Research
Diabetes research is published by institutions across the world.
Some studies report:
- mmol/L
- mg/dL
Others may include both.
Researchers, students, clinicians, and informed patients benefit from understanding conversion because it allows comparison across studies.
This capability improves:
- Evidence-based decision making
- Clinical interpretation
- Research literacy
- International collaboration
Communicating with Healthcare Professionals
Communication is essential for effective diabetes management.
Patients who understand both measurement systems can discuss glucose readings more clearly.
For example:
A patient may say:
“My fasting glucose was 110 mg/dL, which is about 6.1 mmol/L.”
This ensures clarity regardless of the provider’s preferred system.
Managing Diabetes Across Different Healthcare Systems
Many individuals receive healthcare from multiple providers.
Examples include:
- Students studying abroad
- Expatriates
- Military personnel
- International workers
- Frequent travelers
Understanding conversion helps maintain consistency in monitoring and treatment plans across healthcare systems.
Normal Blood Sugar Levels in mmol/L and mg/dL
Knowing how to convert glucose units is useful, but understanding what constitutes a healthy blood sugar range is even more important.
Blood glucose naturally fluctuates throughout the day.
Factors affecting blood sugar include:
- Meals
- Exercise
- Stress
- Illness
- Sleep
- Medication
Healthcare professionals evaluate glucose values within the context of timing and individual health status.
Fasting Blood Sugar Levels
Fasting blood sugar is measured after at least eight hours without food.
This test reflects baseline glucose regulation.
Typical Normal Fasting Range
| mmol/L | mg/dL |
|---|---|
| 3.9–5.5 | 70–99 |
Values within this range generally indicate healthy glucose control.
Elevated Fasting Glucose
| mmol/L | mg/dL |
|---|---|
| 5.6–6.9 | 100–125 |
This range often suggests prediabetes.
Diabetes Threshold
| mmol/L | mg/dL |
|---|---|
| 7.0+ | 126+ |
Repeated readings at or above this level may support a diabetes diagnosis.
Blood Sugar Before Meals
Pre-meal glucose measurements help determine how effectively blood sugar remains controlled between eating periods.
Common target ranges for many adults with diabetes:
| mmol/L | mg/dL |
|---|---|
| 4.4–7.2 | 80–130 |
Healthcare providers may adjust these targets based on individual circumstances.
Blood Sugar After Meals
Postprandial glucose refers to blood sugar measured after eating.
Most often, testing occurs approximately two hours after meals.
Typical target:
| mmol/L | mg/dL |
|---|---|
| Less than 10.0 | Less than 180 |
Meal composition strongly influences post-meal glucose responses.
Foods high in refined carbohydrates generally produce larger glucose spikes.
Bedtime Blood Sugar Targets
Bedtime glucose monitoring helps reduce overnight risks.
Many adults with diabetes aim for:
| mmol/L | mg/dL |
|---|---|
| 5.5–8.3 | 100–150 |
Appropriate targets depend on medication use and risk of nighttime hypoglycemia.
Recommended Levels for Children
Children have unique glucose management needs.
Growth, physical activity, and varying food intake influence glucose patterns.
General targets may include:
| Time | mmol/L | mg/dL |
|---|---|---|
| Before meals | 5.0–7.2 | 90–130 |
| Bedtime | 5.6–8.3 | 100–150 |
Individual goals should always be determined with pediatric healthcare providers.
Recommended Levels for Adults
Adults without diabetes generally maintain:
| mmol/L | mg/dL |
|---|---|
| 3.9–5.5 | 70–99 |
Adults with diabetes often have personalized goals based on:
- Age
- Disease duration
- Medication use
- Complications
- Lifestyle
Recommended Levels for Older Adults
Older adults may require individualized glucose targets.
Aggressive glucose lowering can increase the risk of hypoglycemia.
Healthcare providers often balance:
- Glucose control
- Safety
- Quality of life
- Cognitive function
- Fall prevention
As a result, slightly higher glucose targets may sometimes be appropriate.
Blood Sugar Ranges for Prediabetes and Diabetes
Understanding glucose ranges helps individuals recognize risk levels and make informed health decisions.
Understanding Prediabetes
Prediabetes occurs when blood sugar levels are elevated but not yet high enough to meet diabetes diagnostic criteria.
It serves as an important warning sign.
Without intervention, many individuals with prediabetes eventually develop Type 2 diabetes.
Fortunately, lifestyle changes can significantly reduce progression risk.
Diagnostic Criteria Using mmol/L
Prediabetes fasting glucose:
| Classification | mmol/L |
|---|---|
| Normal | Below 5.6 |
| Prediabetes | 5.6–6.9 |
| Diabetes | 7.0 or higher |
These thresholds are widely recognized in diabetes screening programs.
Diagnostic Criteria Using mg/dL
Equivalent values include:
| Classification | mg/dL |
|---|---|
| Normal | Below 100 |
| Prediabetes | 100–125 |
| Diabetes | 126 or higher |
Understanding both systems ensures accurate interpretation regardless of reporting format.
Type 1 Diabetes Blood Sugar Targets
Type 1 diabetes requires lifelong insulin therapy.
Target glucose ranges often emphasize preventing both hyperglycemia and hypoglycemia.
Common targets include:
Before Meals
| mmol/L | mg/dL |
|---|---|
| 4.4–7.2 | 80–130 |
After Meals
| mmol/L | mg/dL |
|---|---|
| Under 10.0 | Under 180 |
Modern CGM systems help patients stay within target ranges more consistently.
Type 2 Diabetes Blood Sugar Targets
Type 2 diabetes management may involve:
- Diet
- Exercise
- Oral medications
- Injectable medications
- Insulin
Target ranges often resemble those used in Type 1 diabetes, though individual goals vary.
Healthcare providers may adjust targets according to:
- Age
- Comorbidities
- Risk of hypoglycemia
- Treatment intensity
Gestational Diabetes Monitoring
Gestational diabetes develops during pregnancy and requires careful monitoring.
Pregnancy-related hormones can increase insulin resistance.
Common targets include:
Fasting
| mmol/L | mg/dL |
|---|---|
| Below 5.3 | Below 95 |
One Hour After Meals
| mmol/L | mg/dL |
|---|---|
| Below 7.8 | Below 140 |
Two Hours After Meals
| mmol/L | mg/dL |
|---|---|
| Below 6.7 | Below 120 |
Maintaining target glucose levels helps support healthy maternal and fetal outcomes.
HbA1c and Blood Glucose Conversion
Daily glucose measurements provide valuable information, but they only represent specific moments in time.
HbA1c testing offers a broader perspective by reflecting average glucose exposure over several months.
Understanding the relationship between HbA1c and blood glucose improves diabetes management and long-term health monitoring.
What Is HbA1c?
HbA1c, also called glycated hemoglobin, measures the percentage of hemoglobin molecules that have glucose attached to them.
Because red blood cells typically live for about 120 days, HbA1c reflects average blood sugar levels over the previous two to three months.
Unlike a single glucose reading, HbA1c provides insight into long-term glucose control.
Healthcare professionals use HbA1c for:
- Diabetes diagnosis
- Treatment evaluation
- Risk assessment
- Long-term monitoring
Relationship Between HbA1c and Average Glucose
Higher average blood sugar levels result in higher HbA1c values.
The relationship is not perfectly linear for every individual, but standardized formulas allow estimation of average glucose from HbA1c.
For example:
| HbA1c | Average Glucose mg/dL |
|---|---|
| 5% | 97 |
| 6% | 126 |
| 7% | 154 |
| 8% | 183 |
| 9% | 212 |
| 10% | 240 |
These averages help patients connect laboratory results with daily monitoring.
Estimated Average Glucose (eAG)
Estimated Average Glucose (eAG) translates HbA1c percentages into familiar glucose units.
This approach makes HbA1c easier for many patients to understand.
Examples:
| HbA1c | eAG mg/dL | eAG mmol/L |
|---|---|---|
| 5.5% | 111 | 6.2 |
| 6.0% | 126 | 7.0 |
| 7.0% | 154 | 8.6 |
| 8.0% | 183 | 10.2 |
| 9.0% | 212 | 11.8 |
By comparing eAG with daily glucose readings, patients gain a more complete picture of glucose control.
HbA1c Conversion Charts
HbA1c is one of the most valuable measurements in diabetes management because it provides a long-term view of blood glucose control. While daily blood sugar readings fluctuate due to meals, exercise, stress, illness, and medication, HbA1c reflects average glucose exposure over approximately the previous two to three months.
Many patients find HbA1c percentages difficult to interpret. Conversion charts bridge this gap by translating HbA1c values into estimated average glucose levels expressed in both mmol/L and mg/dL.
These charts help answer common questions such as:
- What average glucose corresponds to an HbA1c of 7%?
- How much improvement is needed to lower HbA1c?
- How do daily readings influence long-term results?
Standard HbA1c to Average Glucose Conversion Chart
| HbA1c (%) | eAG (mg/dL) | eAG (mmol/L) |
|---|---|---|
| 4.0 | 68 | 3.8 |
| 4.5 | 82 | 4.6 |
| 5.0 | 97 | 5.4 |
| 5.5 | 111 | 6.2 |
| 6.0 | 126 | 7.0 |
| 6.5 | 140 | 7.8 |
| 7.0 | 154 | 8.6 |
| 7.5 | 169 | 9.4 |
| 8.0 | 183 | 10.2 |
| 8.5 | 197 | 10.9 |
| 9.0 | 212 | 11.8 |
| 9.5 | 226 | 12.6 |
| 10.0 | 240 | 13.4 |
| 11.0 | 269 | 14.9 |
| 12.0 | 298 | 16.5 |
This chart is commonly used in diabetes education programs and healthcare settings worldwide.
Understanding HbA1c Categories
Normal Range
| HbA1c | Interpretation |
|---|---|
| Below 5.7% | Normal glucose regulation |
Individuals in this range generally have healthy glucose metabolism.
Prediabetes Range
| HbA1c | Interpretation |
|---|---|
| 5.7%–6.4% | Prediabetes |
This range indicates elevated diabetes risk.
Diabetes Range
| HbA1c | Interpretation |
|---|---|
| 6.5% or higher | Diabetes |
Diagnosis typically requires confirmation through repeat testing or additional diagnostic criteria.
Why HbA1c Matters
HbA1c is associated with long-term complications such as:
- Eye disease
- Kidney disease
- Nerve damage
- Cardiovascular disease
- Stroke risk
Maintaining HbA1c within target ranges reduces complication risk significantly.
Using HbA1c Alongside Daily Glucose Readings
HbA1c should never replace daily monitoring entirely.
Instead, the two measurements complement each other.
Daily Glucose Monitoring Shows
- Immediate changes
- Meal responses
- Exercise effects
- Medication effectiveness
- Hypoglycemia episodes
HbA1c Shows
- Long-term trends
- Overall glucose exposure
- Treatment effectiveness over months
- Risk of future complications
For example:
A patient may have:
- HbA1c: 7%
- Average glucose: 154 mg/dL
- Average glucose: 8.6 mmol/L
Yet daily readings could range from:
- 60 mg/dL (3.3 mmol/L)
- 250 mg/dL (13.9 mmol/L)
This variability would not be obvious from HbA1c alone.
Combining both measurements provides a much more complete picture of glucose control.
Using an mmol/L to mg/dL Calculator for Diabetes Management
Glucose conversion tools are more than simple mathematical calculators. They play an important role in everyday diabetes management.
Modern diabetes care increasingly involves:
- International travel
- Telemedicine
- Imported medical devices
- Global research access
- Cloud-based monitoring systems
As a result, patients often encounter both measurement systems.
Understanding conversion helps maintain consistency in treatment decisions.
Daily Monitoring Strategies
Daily glucose monitoring remains a cornerstone of diabetes management.
Monitoring frequency depends on:
- Diabetes type
- Medication regimen
- Health goals
- Lifestyle factors
- Physician recommendations
Some individuals check glucose several times per day, while others rely heavily on continuous glucose monitoring systems.
Benefits of Consistent Monitoring
Regular monitoring helps identify:
- High blood sugar episodes
- Low blood sugar episodes
- Meal-related glucose spikes
- Exercise responses
- Illness-related changes
Tracking these patterns allows informed treatment adjustments.
Continuous Glucose Monitoring (CGM)
CGM technology has transformed diabetes management.
Unlike traditional fingerstick testing, CGM systems measure glucose continuously throughout the day and night.
Most devices provide readings every few minutes.
Benefits include:
Real-Time Data
Users can monitor glucose trends instantly.
Trend Arrows
Trend indicators show whether glucose is:
- Rising
- Falling
- Stable
Reduced Fingersticks
Many CGM systems significantly reduce the need for manual testing.
Better Time-in-Range Tracking
Healthcare providers increasingly focus on “time in range” rather than isolated readings.
Understanding CGM Units
CGM devices may display:
- mmol/L
- mg/dL
depending on regional settings.
Patients switching between systems often use conversion calculators until they become familiar with both units.
Fingerstick Blood Glucose Testing
Despite advances in CGM technology, fingerstick testing remains important.
Traditional glucose meters offer:
- Fast results
- Portability
- Affordability
- Reliability
Many healthcare providers still recommend occasional fingerstick confirmation even when CGM is used.
Situations Requiring Fingerstick Testing
Confirming CGM Readings
Occasionally, sensor readings may differ from blood glucose measurements.
Sensor Warm-Up Periods
Some devices require calibration or confirmation during startup.
Device Malfunctions
Backup testing remains important.
Emergency Situations
Rapid confirmation can help guide treatment decisions.
Logging and Tracking Blood Sugar Readings
Tracking glucose values provides valuable insight.
Historically, patients used paper logbooks.
Today, digital tracking tools dominate.
Common tracking methods include:
Mobile Apps
Apps automatically collect and organize glucose data.
Cloud Platforms
Data synchronization enables remote monitoring.
Smart Meters
Many devices upload readings automatically.
Diabetes Management Software
Advanced platforms generate reports and trend analyses.
Benefits of Logging Blood Sugar
Systematic tracking helps identify:
- Consistent fasting patterns
- Meal-related spikes
- Overnight trends
- Medication effects
- Lifestyle influences
Without organized records, important patterns may remain hidden.
Interpreting Trends and Patterns
A single glucose reading rarely tells the whole story.
Trend analysis provides much deeper insights.
Example
Consider the following fasting readings:
| Day | mmol/L | mg/dL |
|---|---|---|
| Monday | 5.8 | 104 |
| Tuesday | 6.0 | 108 |
| Wednesday | 6.2 | 112 |
| Thursday | 6.4 | 115 |
| Friday | 6.6 | 119 |
Although each reading may appear acceptable individually, the upward trend suggests worsening glucose control.
Recognizing patterns early enables proactive intervention.
Using Conversion Tools During Pattern Analysis
When reviewing data from multiple sources, conversion calculators help standardize readings.
Examples include:
- Research studies
- Hospital reports
- CGM exports
- Travel records
- Laboratory results
Consistency improves interpretation accuracy.
Blood Glucose Monitoring Technologies
Technology continues to revolutionize diabetes care.
Modern monitoring systems provide more information than ever before, helping patients and healthcare providers make informed decisions.
Traditional Glucose Meters
Traditional glucose meters remain widely used around the world.
The process typically involves:
- Obtaining a blood sample.
- Applying blood to a test strip.
- Inserting the strip into the meter.
- Receiving a result within seconds.
Advantages of Traditional Meters
Affordable
Many meters are relatively inexpensive.
Portable
Compact designs allow testing almost anywhere.
Reliable
Modern devices achieve high accuracy standards.
Easy to Use
Most require minimal training.
Limitations
Traditional meters only provide single-point measurements.
They cannot show:
- Trends
- Direction of change
- Overnight fluctuations
This limitation contributed to the development of continuous monitoring systems.
Continuous Glucose Monitoring Devices
CGM systems have become increasingly popular.
A small sensor placed under the skin measures glucose continuously.
The sensor transmits data to:
- Smartphones
- Smartwatches
- Dedicated receivers
Key CGM Features
Real-Time Alerts
Users receive notifications for:
- High glucose
- Low glucose
- Rapid glucose changes
Data Visualization
Graphs simplify interpretation.
Remote Monitoring
Caregivers may monitor readings remotely.
Time in Range Analysis
CGM systems calculate the percentage of time glucose remains within target ranges.
Time in Range Explained
Time in Range (TIR) refers to the percentage of time glucose remains within a desired range.
A commonly used target range is:
| mmol/L | mg/dL |
|---|---|
| 3.9–10.0 | 70–180 |
Higher TIR values generally indicate better glucose control.
Smart Diabetes Apps
Mobile health applications now play a central role in diabetes management.
These apps offer numerous features.
Glucose Tracking
Automatic or manual data entry.
Meal Logging
Recording carbohydrate intake.
Medication Reminders
Improving treatment adherence.
Trend Analysis
Identifying recurring patterns.
Conversion Functions
Built-in mmol/L and mg/dL calculators.
Benefits of Smartphone Integration
Smartphone-based management tools improve convenience and accessibility.
Users can review:
- Daily averages
- Weekly trends
- Monthly reports
- HbA1c estimates
from a single dashboard.
Digital Conversion Calculators
Dedicated glucose conversion calculators remain useful despite modern device integration.
They provide:
Instant Results
Conversions occur immediately.
Accuracy
Standardized formulas reduce errors.
Accessibility
Available through:
- Websites
- Mobile apps
- Diabetes portals
- Medical software
Educational Benefits
Repeated use helps users become familiar with both measurement systems.
Features of High-Quality Conversion Tools
The best calculators include:
- Bidirectional conversion
- Decimal precision
- Mobile compatibility
- Fast performance
- Clear user interface
Artificial Intelligence in Diabetes Monitoring
Artificial intelligence is rapidly influencing diabetes care.
AI systems analyze massive datasets to identify patterns that humans might overlook.
Applications include:
Predictive Glucose Modeling
Algorithms estimate future glucose levels.
Personalized Recommendations
Systems provide individualized suggestions.
Risk Detection
Potential hypoglycemia or hyperglycemia episodes can be predicted before they occur.
Automated Insulin Delivery
Advanced insulin pumps increasingly integrate AI-driven decision support.
AI and Glucose Conversion
Although conversion itself is mathematically simple, AI platforms often integrate automatic conversion when combining data from international sources.
This improves:
- Research consistency
- Clinical reporting
- Remote patient monitoring
- Population health analysis
Future of Blood Glucose Monitoring
The future of diabetes monitoring is likely to include:
Non-Invasive Sensors
Researchers continue developing devices that monitor glucose without fingersticks.
Improved Wearables
Smaller and more comfortable sensors are emerging.
Integrated Health Platforms
Glucose data may increasingly merge with:
- Activity tracking
- Nutrition analysis
- Sleep monitoring
- Cardiovascular metrics
Advanced Decision Support
Artificial intelligence will likely become more effective at providing real-time recommendations.
As monitoring technologies continue evolving, understanding glucose units and conversion methods will remain essential. Whether a reading appears in mmol/L or mg/dL, the ability to interpret it correctly supports safer and more effective diabetes management.
Understanding High Blood Sugar (Hyperglycemia)
Hyperglycemia is the medical term for elevated blood glucose levels. It is one of the most common challenges faced by people with diabetes and can also occur temporarily in individuals without diabetes during periods of severe illness, stress, or certain medical treatments.
Understanding hyperglycemia is important because persistent high blood sugar can damage blood vessels, nerves, organs, and tissues throughout the body. Knowing how to interpret glucose values in both mmol/L and mg/dL helps individuals recognize when intervention may be needed.
Causes of Hyperglycemia
Hyperglycemia can result from many factors, ranging from dietary habits to medication issues.
Insufficient Insulin
People with Type 1 diabetes rely on insulin replacement. If insulin delivery is interrupted or insufficient, blood glucose levels can rise rapidly.
Possible causes include:
- Missed injections
- Pump malfunctions
- Incorrect dosing
- Expired insulin
Insulin Resistance
In Type 2 diabetes, the body’s cells become less responsive to insulin.
As insulin resistance increases, glucose remains in the bloodstream rather than entering cells efficiently.
Excess Carbohydrate Intake
Carbohydrates are the primary dietary source of glucose.
Large portions of:
- Sugary drinks
- Desserts
- White bread
- Refined grains
can significantly increase blood sugar levels.
Illness and Infection
The body’s stress response during illness often increases glucose production by the liver.
Common triggers include:
- Influenza
- Pneumonia
- Urinary tract infections
- Viral infections
- Surgical recovery
Emotional Stress
Stress hormones such as cortisol and adrenaline can raise blood glucose levels.
Chronic stress may contribute to long-term glucose management challenges.
Certain Medications
Some medications may increase blood sugar, including:
- Corticosteroids
- Certain psychiatric medications
- Some immunosuppressive therapies
- Specific hormone treatments
Symptoms to Watch For
Hyperglycemia develops gradually in many cases.
Recognizing symptoms early can prevent complications.
Increased Thirst
Excess glucose causes the kidneys to excrete more water, leading to dehydration.
Frequent Urination
High glucose levels draw water into the urine.
Fatigue
Cells cannot efficiently utilize glucose, reducing available energy.
Blurred Vision
Elevated glucose can temporarily affect the shape of the eye’s lens.
Increased Hunger
Despite high blood sugar, cells may not receive adequate energy.
Headaches
Persistent hyperglycemia can contribute to headaches and difficulty concentrating.
Slow Wound Healing
Chronically elevated glucose impairs tissue repair.
Blood Sugar Levels Considered High
Definitions vary depending on timing and individual circumstances.
Fasting Hyperglycemia
| mmol/L | mg/dL |
|---|---|
| Above 7.0 | Above 126 |
Elevated Pre-Meal Glucose
| mmol/L | mg/dL |
|---|---|
| Above 7.2 | Above 130 |
Elevated Post-Meal Glucose
| mmol/L | mg/dL |
|---|---|
| Above 10.0 | Above 180 |
Significant Hyperglycemia
| mmol/L | mg/dL |
|---|---|
| Above 13.9 | Above 250 |
These levels may require immediate attention depending on symptoms and medical history.
Risks of Prolonged Hyperglycemia
Persistently elevated blood sugar can lead to both short-term and long-term complications.
Cardiovascular Disease
High glucose contributes to blood vessel damage and increases the risk of:
- Heart attack
- Stroke
- Peripheral artery disease
Kidney Disease
The kidneys filter enormous volumes of blood daily.
Excess glucose gradually damages these filtering structures.
Nerve Damage
Diabetic neuropathy can affect:
- Feet
- Legs
- Hands
- Digestive system
- Cardiovascular regulation
Eye Disease
Chronic hyperglycemia increases the risk of diabetic retinopathy and vision loss.
Immune Dysfunction
High glucose can impair immune function and increase infection risk.
Management and Prevention Tips
Preventing hyperglycemia involves a combination of lifestyle habits and medical management.
Monitor Blood Sugar Regularly
Frequent monitoring helps identify rising glucose levels early.
Follow Medication Plans
Taking prescribed medications consistently is critical.
Manage Carbohydrate Intake
Balanced nutrition supports stable glucose levels.
Stay Physically Active
Exercise improves insulin sensitivity and glucose utilization.
Stay Hydrated
Adequate hydration supports healthy glucose regulation.
Address Illness Promptly
Sick-day management plans can help prevent severe hyperglycemia.
Understanding Low Blood Sugar (Hypoglycemia)
While high blood sugar receives significant attention, low blood sugar can be equally dangerous.
Hypoglycemia occurs when blood glucose drops below healthy levels and can develop quickly, especially in individuals using insulin or certain diabetes medications.
Recognizing and treating hypoglycemia promptly is essential.
What Causes Hypoglycemia?
Several factors can contribute to low blood sugar.
Excess Insulin
Taking more insulin than needed is a common cause.
Delayed Meals
Skipping meals or eating later than planned may lower glucose levels.
Increased Physical Activity
Exercise increases glucose utilization.
Without adjustments, activity may trigger hypoglycemia.
Alcohol Consumption
Alcohol can interfere with glucose production in the liver.
Medication Interactions
Certain diabetes medications increase hypoglycemia risk.
Warning Signs and Symptoms
Symptoms vary among individuals.
Early Symptoms
Common warning signs include:
- Sweating
- Shakiness
- Hunger
- Nervousness
- Palpitations
Moderate Symptoms
As glucose falls further:
- Confusion
- Difficulty concentrating
- Irritability
- Blurred vision
- Dizziness
may occur.
Severe Symptoms
Severe hypoglycemia can lead to:
- Loss of consciousness
- Seizures
- Inability to self-treat
- Medical emergencies
Blood Sugar Thresholds in mmol/L and mg/dL
Understanding conversion values helps recognize hypoglycemia quickly.
Alert Level
| mmol/L | mg/dL |
|---|---|
| 3.9 | 70 |
This threshold typically signals the need for attention.
Clinically Significant Hypoglycemia
| mmol/L | mg/dL |
|---|---|
| Below 3.0 | Below 54 |
These values require prompt treatment.
Severe Hypoglycemia
Severe hypoglycemia is defined more by symptoms than a specific number.
A person may require assistance regardless of the measured value.
Emergency Treatment Guidelines
Prompt treatment is essential.
The 15-15 Rule
A commonly recommended approach involves:
- Consume approximately 15 grams of fast-acting carbohydrate.
- Wait 15 minutes.
- Recheck blood glucose.
- Repeat if necessary.
Examples of fast-acting carbohydrates include:
- Glucose tablets
- Fruit juice
- Regular soda
- Glucose gel
Severe Cases
If a person is unconscious or unable to swallow:
- Emergency medical assistance may be needed.
- Glucagon administration may be appropriate if available.
Prevention Strategies
Reducing hypoglycemia risk requires planning and awareness.
Monitor Frequently
More frequent monitoring improves safety.
Match Insulin to Meals
Appropriate insulin dosing reduces risk.
Plan for Exercise
Adjustments may be necessary before prolonged activity.
Carry Fast-Acting Carbohydrates
Preparation enables rapid treatment.
Learn Personal Warning Signs
Symptoms vary between individuals.
mmol/L to mg/dL Calculator for Different Medical Tests
Blood glucose measurements appear in numerous medical contexts.
Conversion calculators help standardize interpretation across different healthcare environments.
Blood Glucose Tests
Routine glucose testing remains one of the most common laboratory assessments.
Examples include:
- Fasting glucose
- Random glucose
- Postprandial glucose
- Oral glucose tolerance tests
Each may be reported in either mmol/L or mg/dL.
Plasma Glucose Measurements
Many laboratory reports specifically reference plasma glucose.
Plasma measurements often differ slightly from whole-blood measurements because plasma contains a higher concentration of glucose.
Healthcare providers generally account for these differences automatically.
Conversion between mmol/L and mg/dL remains unchanged.
Laboratory Test Reports
Laboratory reports may include:
- Reference ranges
- Flagged abnormal values
- Historical comparisons
- Diagnostic comments
Understanding conversion helps patients interpret reports obtained from international laboratories.
Hospital Monitoring Systems
Hospitals often utilize integrated monitoring systems.
Patients transferred between facilities may encounter different glucose units.
Conversion tools assist with:
- Care transitions
- Specialist consultations
- International referrals
- Electronic health record reviews
Clinical Research Applications
Research studies frequently compare data collected from multiple countries.
Standardized conversion supports:
- Meta-analyses
- International trials
- Population studies
- Public health research
Accurate conversion ensures consistent interpretation across datasets.
Conversion Examples for Everyday Diabetes Management
Understanding conversion formulas is useful, but practical examples often provide the greatest value.
Daily diabetes management involves numerous situations where unit conversion can improve understanding and decision-making.
Morning Blood Sugar Readings
Morning glucose values are particularly important because they often reflect overnight metabolic activity.
Example 1
Morning reading:
| mmol/L | mg/dL |
|---|---|
| 5.0 | 90 |
Interpretation:
Generally considered a healthy fasting level.
Example 2
Morning reading:
| mmol/L | mg/dL |
|---|---|
| 6.5 | 117 |
Interpretation:
Higher than optimal fasting glucose.
May warrant further monitoring.
Example 3
Morning reading:
| mmol/L | mg/dL |
|---|---|
| 7.5 | 135 |
Interpretation:
Often considered elevated and may require review of diabetes management strategies.
Post-Meal Blood Sugar Measurements
Meals naturally increase blood glucose.
Monitoring post-meal responses provides insight into:
- Carbohydrate tolerance
- Medication effectiveness
- Portion control
Example Conversion
Two-hour post-meal reading:
| mmol/L | mg/dL |
|---|---|
| 8.5 | 153 |
This value falls within common post-meal targets for many individuals.
Higher Example
| mmol/L | mg/dL |
|---|---|
| 12.0 | 216 |
This suggests a significant post-meal glucose rise.
Potential contributing factors include:
- Large carbohydrate intake
- Insufficient medication
- Reduced physical activity
Exercise-Related Blood Sugar Checks
Exercise can influence glucose levels dramatically.
Before Exercise
Example:
| mmol/L | mg/dL |
|---|---|
| 6.7 | 120 |
Generally considered suitable for many forms of physical activity.
After Exercise
Example:
| mmol/L | mg/dL |
|---|---|
| 5.2 | 94 |
This decrease reflects increased glucose utilization.
Monitoring Patterns
Tracking exercise-related glucose responses helps optimize:
- Workout timing
- Nutrition strategies
- Insulin adjustments
Illness and Stress Monitoring
Illness often affects blood sugar regulation.
Mild Illness Example
| mmol/L | mg/dL |
|---|---|
| 10.5 | 189 |
Elevated glucose may occur temporarily during infection.
Severe Illness Example
| mmol/L | mg/dL |
|---|---|
| 15.0 | 270 |
Such readings may require additional monitoring and medical guidance.
Stress Response
Psychological stress can also elevate glucose levels through hormonal mechanisms.
Tracking converted values consistently helps identify these patterns.
Travel and Time Zone Adjustments
Travel introduces unique challenges.
Potential issues include:
- Meal timing changes
- Activity level changes
- Jet lag
- Medication scheduling
- Different healthcare systems
Example
A traveler from Australia sees:
| mmol/L | mg/dL |
|---|---|
| 7.2 | 130 |
Later, a clinic in the United States reports:
| mg/dL | mmol/L |
|---|---|
| 130 | 7.2 |
Understanding conversion confirms the values are identical.
Practical Travel Tips
Carry Conversion References
A small conversion chart can be extremely useful.
Understand Device Settings
Some meters allow switching between units.
Keep Medical Records Accessible
Digital records simplify communication with healthcare providers abroad.
Learn Key Emergency Values
Recognizing critical glucose thresholds in both units improves safety during travel.
Everyday Benefits of Knowing Both Systems
Patients who understand both mmol/L and mg/dL often feel more confident when:
- Reading research articles
- Using new devices
- Discussing treatment with specialists
- Traveling internationally
- Comparing laboratory reports
Rather than relying solely on conversion tools, many eventually memorize common values.
Examples include:
| mmol/L | mg/dL |
|---|---|
| 4.0 | 72 |
| 5.0 | 90 |
| 6.0 | 108 |
| 7.0 | 126 |
| 8.0 | 144 |
| 10.0 | 180 |
These familiar reference points make everyday interpretation faster and easier.
Common Questions About Blood Sugar Conversion
Blood glucose conversion is a topic that frequently raises questions among patients, caregivers, healthcare professionals, and even researchers. Although the mathematical conversion itself is straightforward, understanding when and why to convert values is equally important.
This section addresses some of the most common questions related to mmol/L and mg/dL measurements.
Is mmol/L More Accurate Than mg/dL?
One of the most frequent misconceptions is that one unit must be more accurate than the other.
In reality, neither mmol/L nor mg/dL is inherently more accurate.
Both units describe exactly the same glucose concentration using different measurement systems.
For example:
| mmol/L | mg/dL |
|---|---|
| 5.0 | 90 |
| 6.0 | 108 |
| 7.0 | 126 |
The underlying blood glucose level remains identical.
The choice of unit depends on:
- National standards
- Laboratory practices
- Healthcare system preferences
- Device configuration
Accuracy depends on the quality of the measurement, not the reporting unit.
Which Unit Do Doctors Prefer?
Preferences vary significantly by country.
Healthcare providers typically use the unit adopted by their national healthcare system.
Common mmol/L Countries
- United Kingdom
- Canada
- Australia
- New Zealand
- Germany
- France
- Sweden
- Norway
Common mg/dL Countries
- United States
- Japan
- South Korea
- Several Latin American countries
Most healthcare professionals are familiar with both systems, particularly specialists who work with international patients or research data.
Can Conversion Errors Affect Treatment?
Yes.
Conversion mistakes can potentially lead to misunderstanding or inappropriate treatment decisions.
For example:
A reading of:
- 5.0 mmol/L
is equivalent to:
- 90 mg/dL
If someone incorrectly interprets 5.0 mmol/L as 50 mg/dL, they may believe severe hypoglycemia is occurring when it is not.
Similarly:
- 15 mmol/L = 270 mg/dL
Misinterpreting units could result in delayed treatment of significant hyperglycemia.
Double-checking units is always important.
Why Do Glucose Meters Use Different Units?
Manufacturers design devices for specific markets.
A glucose meter sold primarily in:
- Canada
- Australia
- Europe
may display mmol/L by default.
A device sold in:
- United States
- Japan
- South Korea
may display mg/dL.
Many modern meters allow users to switch between units, although some models are locked to comply with regional regulations.
Should Patients Learn Both Measurement Systems?
Learning both systems provides several advantages.
Benefits include:
- Easier travel
- Better understanding of international research
- Improved communication with healthcare professionals
- Greater confidence using imported devices
- Better interpretation of online educational resources
Many experienced diabetes patients eventually memorize key conversion points.
Common examples include:
| mmol/L | mg/dL |
|---|---|
| 4 | 72 |
| 5 | 90 |
| 6 | 108 |
| 7 | 126 |
| 8 | 144 |
| 10 | 180 |
Memorizing these values makes interpretation much faster.
Medical Guidelines and International Standards
Blood glucose measurement standards are influenced by international organizations, national health agencies, and scientific societies.
These organizations establish diagnostic criteria, treatment recommendations, and monitoring guidelines that healthcare professionals follow worldwide.
Understanding these standards helps patients place glucose readings into a broader clinical context.
World Health Organization Recommendations
The World Health Organization (WHO) plays a major role in global diabetes awareness and prevention efforts.
WHO guidelines emphasize:
- Early diagnosis
- Risk factor reduction
- Lifestyle modification
- Access to treatment
- Long-term monitoring
When discussing blood glucose measurements, WHO recognizes internationally accepted diagnostic thresholds regardless of reporting units.
Fasting Plasma Glucose
| mmol/L | mg/dL |
|---|---|
| 7.0 | 126 |
This value is widely used as a diagnostic threshold for diabetes.
Impaired Fasting Glucose
| mmol/L | mg/dL |
|---|---|
| 6.1–6.9 | 110–125 |
This range indicates increased diabetes risk.
WHO also emphasizes the importance of HbA1c testing where available.
International Diabetes Federation Guidelines
The International Diabetes Federation (IDF) represents diabetes organizations across numerous countries.
Its mission includes:
- Improving diabetes care
- Promoting education
- Supporting prevention initiatives
- Encouraging international collaboration
The IDF recognizes that glucose reporting units vary globally and encourages healthcare providers to ensure patients understand whichever measurement system is being used.
Key IDF Monitoring Goals
The organization supports:
- Regular glucose monitoring
- Individualized targets
- HbA1c assessment
- Risk reduction strategies
- Patient education
Conversion tools play an important role in international diabetes communication.
American Diabetes Association Standards
The American Diabetes Association (ADA) publishes annual standards of care that strongly influence diabetes management worldwide.
The ADA primarily reports glucose values using mg/dL because this is the standard unit in the United States.
Common ADA targets include:
Pre-Meal Glucose
| mg/dL | mmol/L |
|---|---|
| 80–130 | 4.4–7.2 |
Peak Post-Meal Glucose
| mg/dL | mmol/L |
|---|---|
| Less than 180 | Less than 10.0 |
Diabetes Diagnosis
| mg/dL | mmol/L |
|---|---|
| 126 | 7.0 |
These values correspond directly to international equivalents.
European Diabetes Monitoring Practices
Many European countries use mmol/L reporting standards.
European diabetes management often emphasizes:
- Continuous glucose monitoring
- Time in Range metrics
- Personalized treatment plans
- Structured education programs
The increasing adoption of CGM technology has shifted focus toward trend analysis rather than isolated glucose measurements.
European healthcare systems also frequently integrate digital health platforms that automatically perform glucose conversions when needed.
Future Trends in Glucose Measurement
Blood glucose monitoring continues evolving rapidly.
Several emerging trends are likely to shape the future of diabetes care.
Increased CGM Adoption
Continuous glucose monitoring devices are becoming:
- Smaller
- More accurate
- More affordable
As adoption increases, real-time data may become the standard for many patients.
Greater Personalization
Future monitoring systems will likely provide more individualized recommendations.
Improved Interoperability
Healthcare systems increasingly share information electronically.
Automatic unit conversion will become more seamless.
Artificial Intelligence Integration
AI-powered platforms may identify:
- Glucose trends
- Behavioral patterns
- Risk factors
- Treatment opportunities
before problems become clinically significant.
Non-Invasive Monitoring
Researchers continue exploring technologies that measure glucose without fingersticks or implanted sensors.
Although challenges remain, future breakthroughs could transform diabetes management.
Building Your Own mmol/L to mg/dL Calculator
For developers, educators, healthcare organizations, and website owners, creating a glucose conversion calculator can provide valuable functionality.
Fortunately, blood glucose conversion uses a simple formula that is easy to implement.
Using Spreadsheet Formulas
Spreadsheet applications provide one of the easiest ways to create a glucose calculator.
Convert mmol/L to mg/dL
Formula:
=A1*18Convert mg/dL to mmol/L
Formula:
=A1/18Where:
- A1 contains the glucose value.
This approach is useful for:
- Clinics
- Research projects
- Educational materials
- Personal tracking systems
Calculator Integration for Websites
Many healthcare websites include glucose conversion tools.
A basic implementation requires:
User Input Field
Users enter a glucose value.
Unit Selection
Users choose:
- mmol/L
- mg/dL
Conversion Function
The website applies the appropriate formula.
Display Output
Results appear instantly.
Such tools improve user experience and encourage engagement.
Mobile App Implementation
Mobile diabetes applications frequently incorporate glucose conversion.
Common features include:
Instant Conversion
Real-time results as values are entered.
Historical Tracking
Conversion integrated with glucose logs.
Offline Functionality
No internet connection required.
Automatic Unit Detection
Some applications recognize incoming data formats automatically.
These capabilities simplify international use.
API-Based Conversion Solutions
Healthcare software platforms often exchange data through APIs.
Conversion functions can be integrated directly into these systems.
Benefits include:
Standardized Reporting
Data remains consistent regardless of source.
Reduced Manual Errors
Automated conversion eliminates calculation mistakes.
Improved Interoperability
Different healthcare systems communicate more effectively.
Better Research Integration
International datasets become easier to compare.
Best Practices for Accuracy
Even simple calculators should follow best practices.
Use Standard Conversion Factors
Always use:
- Multiply by 18
- Divide by 18
for glucose conversion.
Display Decimal Precision Clearly
Rounding should remain consistent.
Label Units Prominently
Users must immediately recognize which unit is displayed.
Validate User Input
Prevent invalid entries.
Test Thoroughly
Verification against known conversion values improves reliability.
Include Reference Examples
Examples help users understand results more quickly.
Frequently Asked Questions
How Do I Convert mmol/L to mg/dL Quickly?
Multiply the mmol/L value by 18.
Examples:
| mmol/L | mg/dL |
|---|---|
| 4 | 72 |
| 5 | 90 |
| 6 | 108 |
| 7 | 126 |
What Is the Formula for Blood Sugar Conversion?
For mmol/L to mg/dL:
mg/dL=mmol/L×18
For mg/dL to mmol/L:
mmol/L=18mg/dL
Is 7 mmol/L a Normal Blood Sugar Level?
It depends on timing.
Fasting
7 mmol/L (126 mg/dL) is generally considered elevated and may indicate diabetes if confirmed by repeat testing.
After Meals
7 mmol/L may fall within acceptable ranges for many individuals.
What Is 100 mg/dL in mmol/L?
Calculation:
100 ÷ 18 = 5.6 mmol/L
Result:
100 mg/dL = 5.6 mmol/L
Why Does My Glucose Meter Use mmol/L?
Many countries use SI units as part of national laboratory standards.
If you live in:
- United Kingdom
- Canada
- Australia
- New Zealand
- Most of Europe
your device likely uses mmol/L.
Can I Switch Measurement Units on My Meter?
Many modern meters allow switching.
However:
- Some devices are locked by region.
- Certain healthcare regulations restrict changing units.
Consult your device manual before making changes.
What Is the Best mmol/L to mg/dL Calculator?
The best calculator should offer:
- Instant conversion
- Accurate formulas
- Mobile compatibility
- Clear interface
- Bidirectional conversion
Many diabetes apps and healthcare websites include reliable calculators.
Are Online Conversion Tools Accurate?
Most reputable tools are highly accurate because the conversion formula is standardized.
However, users should:
- Verify units carefully
- Use trusted healthcare resources
- Confirm unusual results
The calculator itself cannot correct inaccurate glucose measurements.
Final Thoughts
Blood glucose monitoring has become an essential component of modern healthcare. Whether managing diabetes, evaluating metabolic health, reviewing laboratory reports, or participating in clinical research, understanding glucose measurements empowers individuals to make informed decisions.
Although mmol/L and mg/dL may initially appear confusing, they simply represent two different ways of expressing the same glucose concentration. Learning how to move between these units removes barriers to understanding and improves communication across healthcare systems.
Key Takeaways About Blood Glucose Conversion
Several core concepts are worth remembering.
Both Units Measure the Same Thing
mmol/L and mg/dL describe identical glucose concentrations.
Only the reporting format differs.
Conversion Is Simple
To convert mmol/L into mg/dL:
Multiply by 18.
To convert mg/dL into mmol/L:
Divide by 18.
Familiarity Improves Confidence
Learning common conversions helps patients interpret readings quickly without always relying on calculators.
Examples include:
| mmol/L | mg/dL |
|---|---|
| 4 | 72 |
| 5 | 90 |
| 6 | 108 |
| 7 | 126 |
| 10 | 180 |
Importance of Accurate Monitoring
Accurate glucose monitoring supports:
- Better treatment decisions
- Reduced complication risk
- Improved quality of life
- Enhanced long-term outcomes
Regardless of the measurement unit used, consistency remains essential.
Reliable monitoring helps identify:
- Hyperglycemia
- Hypoglycemia
- Lifestyle influences
- Medication effectiveness
- Long-term trends
Using Conversion Tools Safely
Conversion calculators are valuable resources, but they should be used carefully.
Best practices include:
- Confirming the original unit
- Checking decimal placement
- Using reputable tools
- Understanding common reference values
- Discussing concerns with healthcare providers
A conversion calculator assists interpretation but does not replace professional medical advice.
Staying Informed About Diabetes Management
Diabetes care continues evolving through advances in:
- Continuous glucose monitoring
- Artificial intelligence
- Digital health platforms
- Personalized medicine
- Predictive analytics
Patients who remain informed are better positioned to benefit from these innovations.
Understanding glucose conversion is one small but important part of broader diabetes education.
Choosing the Right mmol/L to mg/dL Calculator
The ideal calculator should be:
- Accurate
- Fast
- Easy to use
- Mobile-friendly
- Accessible from anywhere
Whether integrated into a glucose meter, smartphone app, healthcare portal, spreadsheet, or website, a reliable conversion tool simplifies communication and promotes confidence in glucose management.
As healthcare becomes increasingly connected across countries and technologies, understanding both mmol/L and mg/dL will remain a valuable skill. By learning how blood glucose units relate to one another and applying that knowledge consistently, patients, caregivers, and healthcare professionals can interpret results more effectively and support better health outcomes over the long term.


